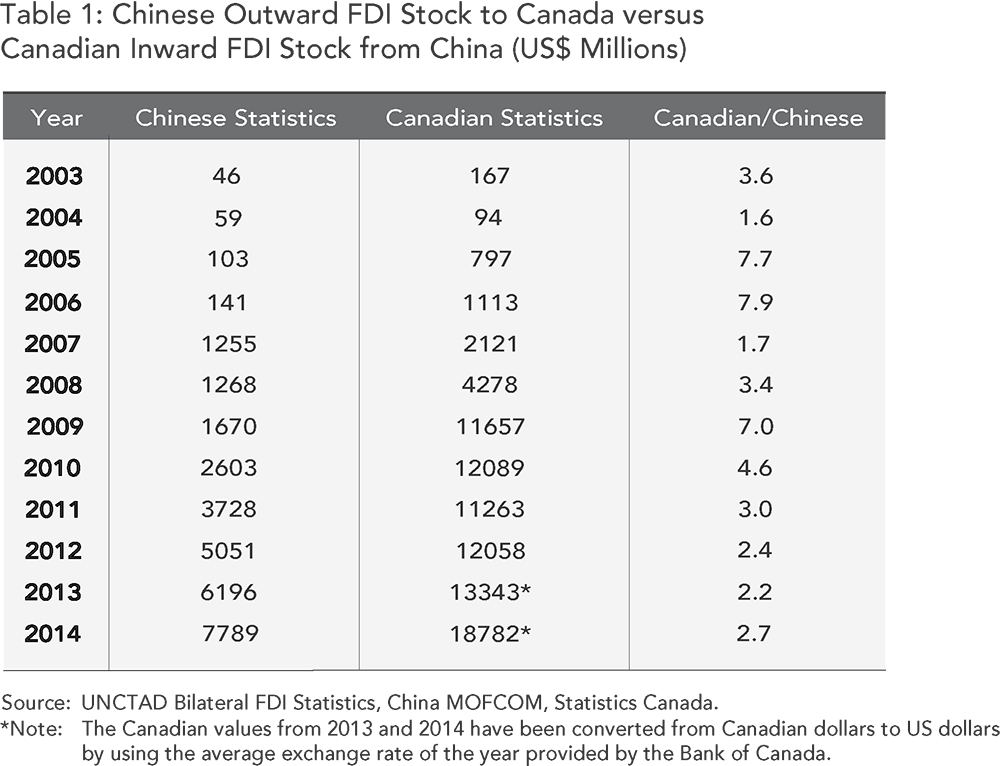
Since the mid-2000s, bilateral investment between Canada and China has been exponentially growing and is expected to continue. Unbeknownst to many Canadians is the widely unexplored fact that there are stark differences between Canadian and Chinese official foreign direct investment (FDI) statistics. In 2014, using Chinese sources, the United Nations Conference on Trade and Development (UNCTAD) reported that Chinese companies invested US$7.8 billion into Canada. Statistics Canada, on the other hand, showed that US$18.8 billion was invested into Canada from China. That is more than double the number that China reported. This discrepancy has existed for the past decade, as shown in Table 1. In recent years (2012-2014), the difference in reported totals has been more than two-fold.
Large discrepancies in reported investment totals are not restricted to China-Canada FDI statistics. On April 19, 2016, China’s Ministry of Commerce (MOFCOM) announced that China’s total overseas investment through mergers and acquisitions reached US$16.56 billion, whereas a different report from Bloomberg pegged that figure at US$113 billion, or 6.82 times more than the official data released by MOFCOM.
These apparent discrepancies give rise to the question: why are there such large differences between China’s official statistics and other institutions’ or countries’, in particular Canada’s, official statistics? Unfortunately, there is limited scholarly material available that explains these large discrepancies. Academics have attributed the discrepancies to the varying methodologies used to collect and calculate Chinese statistics. They also highlight that China’s numbers vary according to the source of the statistics: MOFCOM or the State Administration of Foreign Exchanges (SAFE).
The most frequently mentioned reason for diverging statistics is the methodology MOFCOM uses to calculate China’s outward FDI. Chinese FDI entities are required by MOFCOM to register the first destination rather than the final destination of cross-border investment transactions. At first glance, this seems non-problematic, but when offshore financial centres come into play, it can be complicated to calculate exactly where the money goes.
The International Monetary Fund defines an offshore financial centre as “a centre where the bulk of financial sector activity is offshore on both sides of the balance sheet (that is the counterparties of the majority of financial institutions liabilities and assets are non-residents), where the transactions are initiated elsewhere, and where the majority of the institutions involved are controlled by non-residents.” Almost like tax havens, offshore centres are often favoured by relatively lower tax rates and superior know-how, making them ideal conduits for global trade and investment.
M&As are often completed through subsidiaries registered in offshore financial centres to benefit from these advantages. Major offshore centres include Hong Kong SAR, the Bahamas, Jersey, the Cayman Islands, and the British Virgin Islands. It is estimated that at least 30 per cent of total FDI stocks in the world are intermediated through these types of offshore centres. Considering this significant percentage and their linkages with other financial centres around the world, offshore centres have the potential to affect financial stability in a number of countries.
In the case of China, three offshore financial centres—Hong Kong SAR, the Cayman Islands, and the British Virgin Islands—account for around 70 per cent of China’s total outward FDI stocks. Since China’s fixed exchange rate system and independent monetary policy lead to tight capital controls, these offshore centres act as intermediaries of investment flows between China and the world because of their relatively lower tax rates. Hong Kong’s proximity and close economic links with China makes Hong Kong an ideal intermediary, with an estimated 60 per cent of all China’s outward FDI ending up in Hong Kong.
Often times Hong Kong SAR or other offshore financial centres are seen as the destination being invested in while in fact the final destination country is elsewhere. An investment from China to Canada that first goes through Hong Kong SAR would be registered by China as an investment into Hong Kong SAR, rather than an investment into Canada. At the same time, Canada credits it as investment from China rather than Hong Kong SAR, thereby causing a discrepancy in official statistics. Chinese outward FDI to final destination countries like Canada is therefore understated, whereas to offshore centres like Hong Kong SAR it is overstated, as can be seen in Table 2.

A notable example of investing through an offshore centre was the 2013 largest-ever Chinese acquisition of a U.S. company, Smithfields Foods. The investment was worth US$4.7 billion, but was never registered in China as an investment from China to the U.S. Instead, since the transaction took place via a shell company in the Cayman Islands, China calculated the transaction as an investment into the Cayman Islands, the first destination. A similar situation occurred in Canada in 2012, when CEFC Shanghai Oil Group Co. Ltd., a Chinese entity that manages energy industry projects, invested some C$2 million in Ottawa-based Beaufield Resources Inc. through its wholly owned subsidiary in Hong Kong, Hongkong Huaxin Petroleum Ltd. Again, that transaction was recognized by China as an investment into Hong Kong SAR, and not into Canada.
Owing to the apparent deficiencies in China’s statistical system, partially due to offshore financing, official statistics can only provide a limited understanding of the growth and pattern of Chinese outward FDI. When interpreting Chinese outward FDI statistics, it is important to carefully do so. In the near future, as some countries have already done, China may update its methodology to meet the newest international standards on tracking FDI, which advises counting by final destination of investment rather than first. In spite of these limitations, it is undeniable that Chinese outward FDI has been growing very quickly over the past decade. Canada-China investment relations are likely to continue growing over the next years, especially considering current Prime Minister Justin Trudeau’s intention to play a more significant role in promoting Canada-China business and investment.
To fill the statistical gap between Canadian and Chinese FDI stocks, the Asia Pacific Foundation of Canada is collecting data for FDI flows between Canada and Asian countries, including China, which will trace investments to their ultimate sources and destinations. The database will be launched on the APF Canada website in winter 2016-2017.
Iris Jin, Senior Program Manager, Asia Pacific Foundation of Canada; Valentine Ostaszewski, Research Analyst, Asia Pacific Foundation of Canada